The “Overall Inspection Effectiveness” KPI: Why it’s Broken (and How to Fix It)
The “Overall Inspection Effectiveness” KPI is misleading! It simplifies inspections to a single volatile metric and gives little indication to what is actually happening.


In a recent scroll of the well renowned social media site for professionals, ala LinkedIn, I came across a post that looked great at first glance, but raised not one, but two eyebrows as I dug deeper. As one who relishes reliability metrics as a measure of how well we are looking after the assets in our care, I also like to lift the lid to uncover the BS, and make sure we're delivering real value.
Said LinkedIn post for reference:
Is there a single metric that captures the essence of effective inspections? Absolutely not. The idea of using "Overall Inspection Effectiveness" as a KPI raises serious concerns for those who understand the true value and intricacies of inspection processes, why we do inspections, and what sort of inspections are common in industry. I will provide some simple examples to illustrate my point.
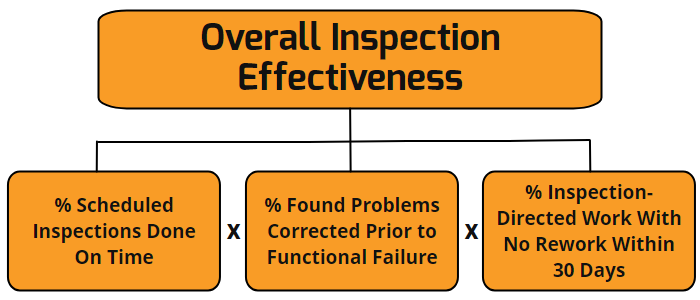
While at first glance, the Overall Inspection Effectiveness (OIE) metric sounds like a maintenance managers dream, right?
"Inspection Effectiveness is down boss."
"Do more inspections on time!" / "Find more problems!" / "Do work with no rework within 30 days!"
Could you imagine that conversation?
% Scheduled Inspections Done On Time
This metric itself is not a terrible metric, but it is somewhat limited. High reliability organisations should be tracking the ratio of ALL preventive maintenance activities, and planned corrective activities (excluding break-in work) against the schedule. The maintenance schedule is the agreed activities to be undertaken in a block of time, generally a week.
When unplanned, unscheduled work of high priority arises, then we usually accommodate said break-in work by way of sacrificing jobs from the agreed schedule. The jobs that usually get sacrificed are the ones that we perceive to have the lowest influence on asset availability/reliability/production or whatever drives your plant. Generally, it's these inspections that make way for the heroes to save the day.
What does "on time" mean? Sure, each organisation and each operation will have their own definitions. "On time" may even vary from team to team, and from inspection to inspection. A risk based approach might vary "on time" by criticality. "On time" might vary by the frequency of the inspection, I.e. a weekly inspection might be considered "on time" if it is done in the first half of the week. An annual inspection might be "on time" if it's done in +/- 1 month.
While we should track the completion ratio of ALL scheduled work, to single out inspections would be a mistake. It is, however, important to understand what work has been bumped to make way for the break-in work. If we see a pattern of the same jobs being bumped, then we should be asking ourselves: what can we do to ensure this work gets done?
And that's a topic for another day.
% Found Problems Corrected Prior to Functional Failure
For this component of the metric to work, we have to be tracking, for each inspection, each problem we have found, and for each problem we have found, if it has been corrected or not, and for each problem found, which failure mode it affects, and for each functional failure, was it related to the failure mode from the inspection. I get the feeling that most organisations aren't even tracking functional failures, let alone which inspection would find the related functional failure.
From what I've seen across various sites, most people doing the inspections are clueless as to why an inspection is required. It's not a poor reflection on them. It's a poor reflection of the maintenance plan that we have given them. Often I see inspections tend to be inspections for the sake of doing inspections. One site I worked at for some time, the manager wanted people doing inspections all day "just to keep them busy."

A high reliability organisation will understand the link between failure modes and the associated inspections. We've all built our maintenance plans from well developed RCM principles, right? Right? At least a good FMECA? Anyway, so long as we have an understanding of why we're doing the inspections, that information isn't always passed along to the people doing the inspections. And this is where the interrelated tracking of inspections -> problems -> failure modes -> functional failures will fall down. At least until we have the holy grail of digitised inspection sheets that record the data in a suitable format.
What happens if we have an inspection that is based on solid RCM logic? If we have a device with a hidden failure mode. The old smoke detector example is a favourite. We have to inspect it every x months. This inspection actually entails a functional test. We have to press the test button to see if the smoke detector beeps. If we've bought good quality smoke detectors, then we should see very few failures before the Weibull curve kicks up. That could be 10+ years. So for those 10+ years before we have a failure, we're not detecting a problem. Hence this metric component would be low, bringing down the OIE score. Don't we want high OIE? Does this mean that we shouldn't do these functional tests? Absolutely not.
Similarly for condition monitoring. These are generally "inspection" activities. Taking a temperature measurement, a noise reading, a vibration spectra. While these might not require a corrective action to avoid a functional failure, they can inform how we operate an asset.
What about when our strategy for an asset is run to failure? You might think that if we run to failure, then we don't care about the asset and therefore shouldn't waste time doing inspections. I will forgive you, but run to failure is a valid strategy, although one that should not be taken lightly. There may be various reasons why a run to failure strategy is chosen. The cost to maintain vs the cost to replace is usually a key driver. Another key factor is the ability to maintain, especially from a safety or environmental standpoint. Even if we choose to run to fail on an asset, we can still inform ourselves of the impending failure, so that we can respond when the failure occurs. For example, a small pump is regularly inspected as a part of a wider route. The pump motor is found to be hot to the touch, and a suspected bearing failure is imminent. We have a spare in stock and there is a standby pump. The last time this happened, the motor ran for 6 months after detection. An inspection that notifies us of the impending failure, but is not corrected prior to the functional failure, results in a lower OIE. Yet for this example, the inspection may be effective. The motor can be run to failure and then changed.
A better alternative here would be to just track the work requests. Track how many, how important they are (priority verified through the screening process), how long they have been in the system for, and the associated asset's criticality.
We should be doing this anyway.
% Inspection-Directed Work With No Rework Within 30 Days
This component is starting to go outside of the effectiveness of an inspection. This component is more about the effectiveness of the work that is applied. As with the other metrics, it's a good thing to track rework, but don't limit it to inspections. As for the time limitation, I'd remove it. If work requires rework, then it wasn't good quality work, regardless of 30 days or not. Poor quality work should generally be evident immediately, although there are situations where poor quality work could only become evident after some time in service.
Overall Inspection Effectiveness
So I've picked apart each of the components that make up the Overall Inspection Effectiveness. What's left is to look at what the OIE might look like in a week to week scenario.
Let's say in week one we're tracking with a high OIE > 90%.
Week 2: We have 5 important inspections, none find an issue related to a functional failure. OIE drops to (5/5 x 0 x 1) = 0%.
Week 3: We only have 3 inspections to do. 2 get bumped due to break-in work. The other 1 inspection is perfect. It finds an issue, no rework. OIE down to (1/3 x 1 x 1) = 33%.
I don't think I need any more examples to illustrate how volatile this metric can be. In each week, each of the inspections could be done perfectly with each perfectly fulfilling the reason why they were implemented. Yet this metric bounces around like a yo-yo. How could this possibly be used to reliably inform decisions is beyond me. There is far more nuance to maintenance management than mashing some numbers together to get another number.
Summary
While the OIE metric is made up of some valid components, these components should not be limited to just inspections. Absolutely these metric components should not be mashed together to try and derive a single figure that describes maintenance performance.
We should focus on tracking metrics that matter.
Are we planning the right work to be done?
Are we setting the right priorities?
Are we allowing for break-in work?
Do we understand what work has been bumped?
Are we effectively managing the backlog?
So, while the siren call of a single, all-encompassing "Overall Inspection Effectiveness" metric might seem tempting, remember that maintenance excellence is about much more than just numbers. By focusing on truly meaningful metrics – those that reveal our planning prowess, prioritisation skills, and ability to manage work backlogs effectively – we can paint a much clearer picture of our reliability journey. Let's ditch the overly simplistic OIE and embrace a more nuanced approach that celebrates the complexity and criticality of what we do. After all, effective maintenance isn't about chasing arbitrary scores; it's about ensuring our assets keep humming along reliably, safely, and efficiently.
AI disclaimer: AI wrote approximately 6% of this post.
Models used: gemma2:9b